Aviator graph analysis is one of the most common habits among crash game players, and one of the least useful. The rising curve and the strip of past multipliers above it are a record, not a forecast. They tell you exactly what already happened and nothing at all about what happens next, because every round is generated independently.
That doesn’t mean the display is pointless. Reading it correctly helps you understand the game’s variance, sanity-check your cash-out habits, and spot when your expectations have drifted away from the math. Reading it incorrectly costs money. Here’s the difference.
What the Aviator graph actually shows
Two separate things are on screen: a live curve for the current round, and a history of finished rounds. Both are outputs. Neither is an input to the next result.
The round history strip
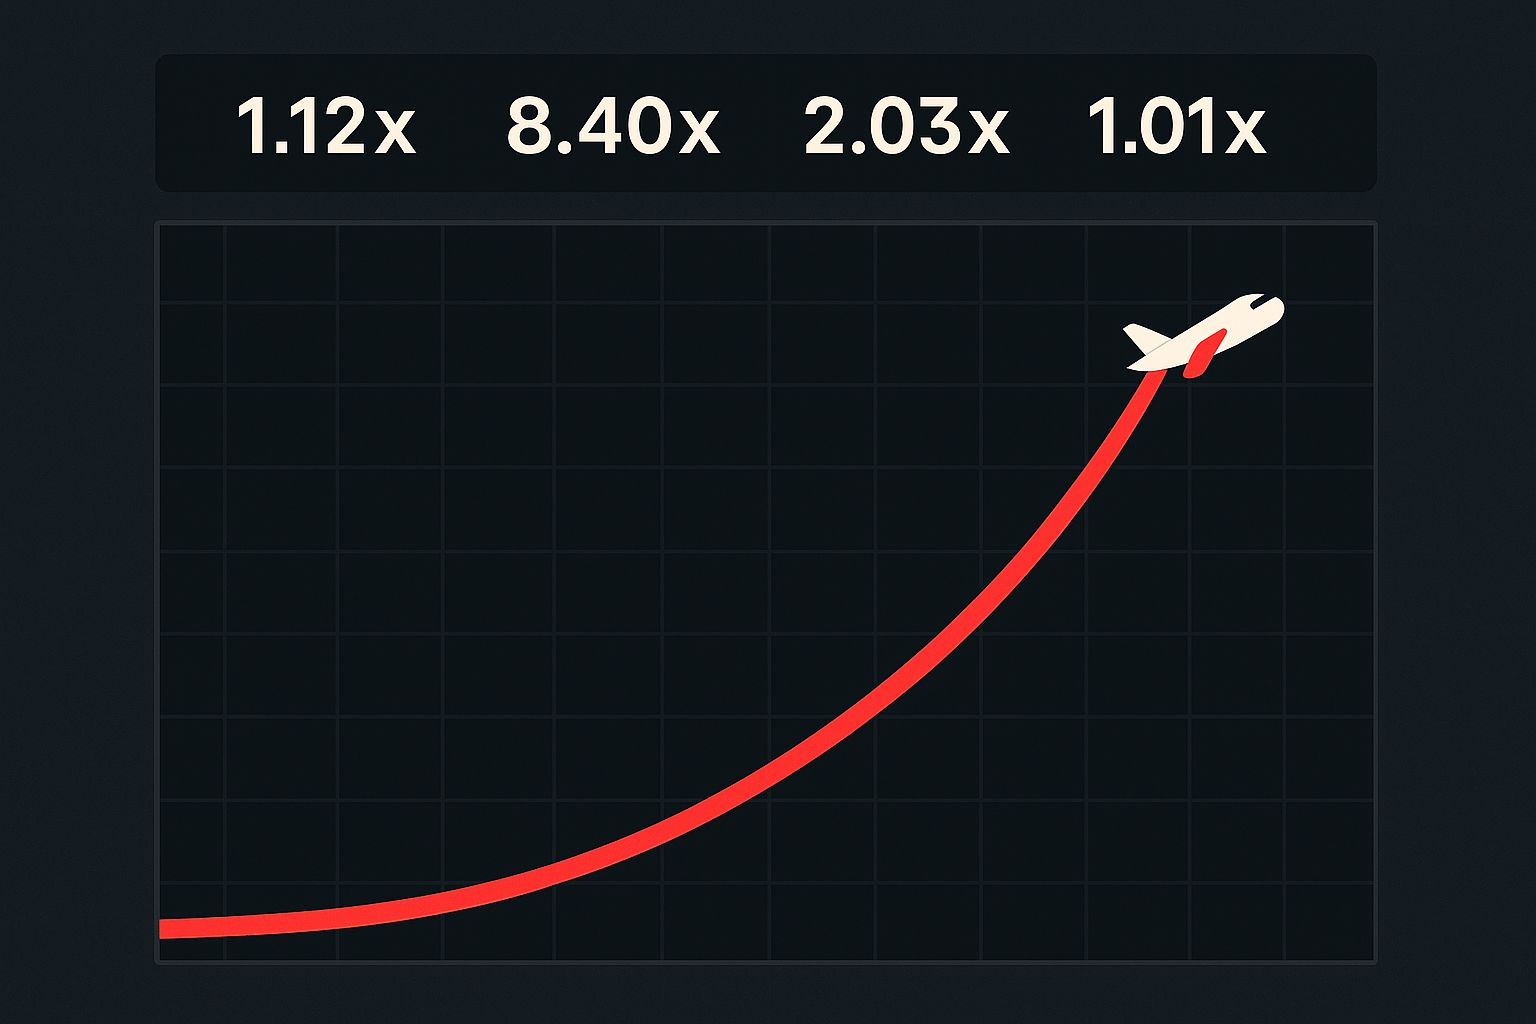
The aviator multiplier history is the horizontal row of numbers along the top of the screen: 1.02x, 3.41x, 1.19x, 24.7x, and so on. Each value is the multiplier at which that round’s plane flew away. Most versions colour-code them, so low crashes look one way and big multipliers another, and you can usually tap the panel to expand the aviator round history into a longer list or a stats view.
What it contains: a factual log of completed rounds. What it does not contain: any weighting, momentum, or “state” that carries into the next round. The strip is closer to a scoreboard than a weather forecast.
The live multiplier curve
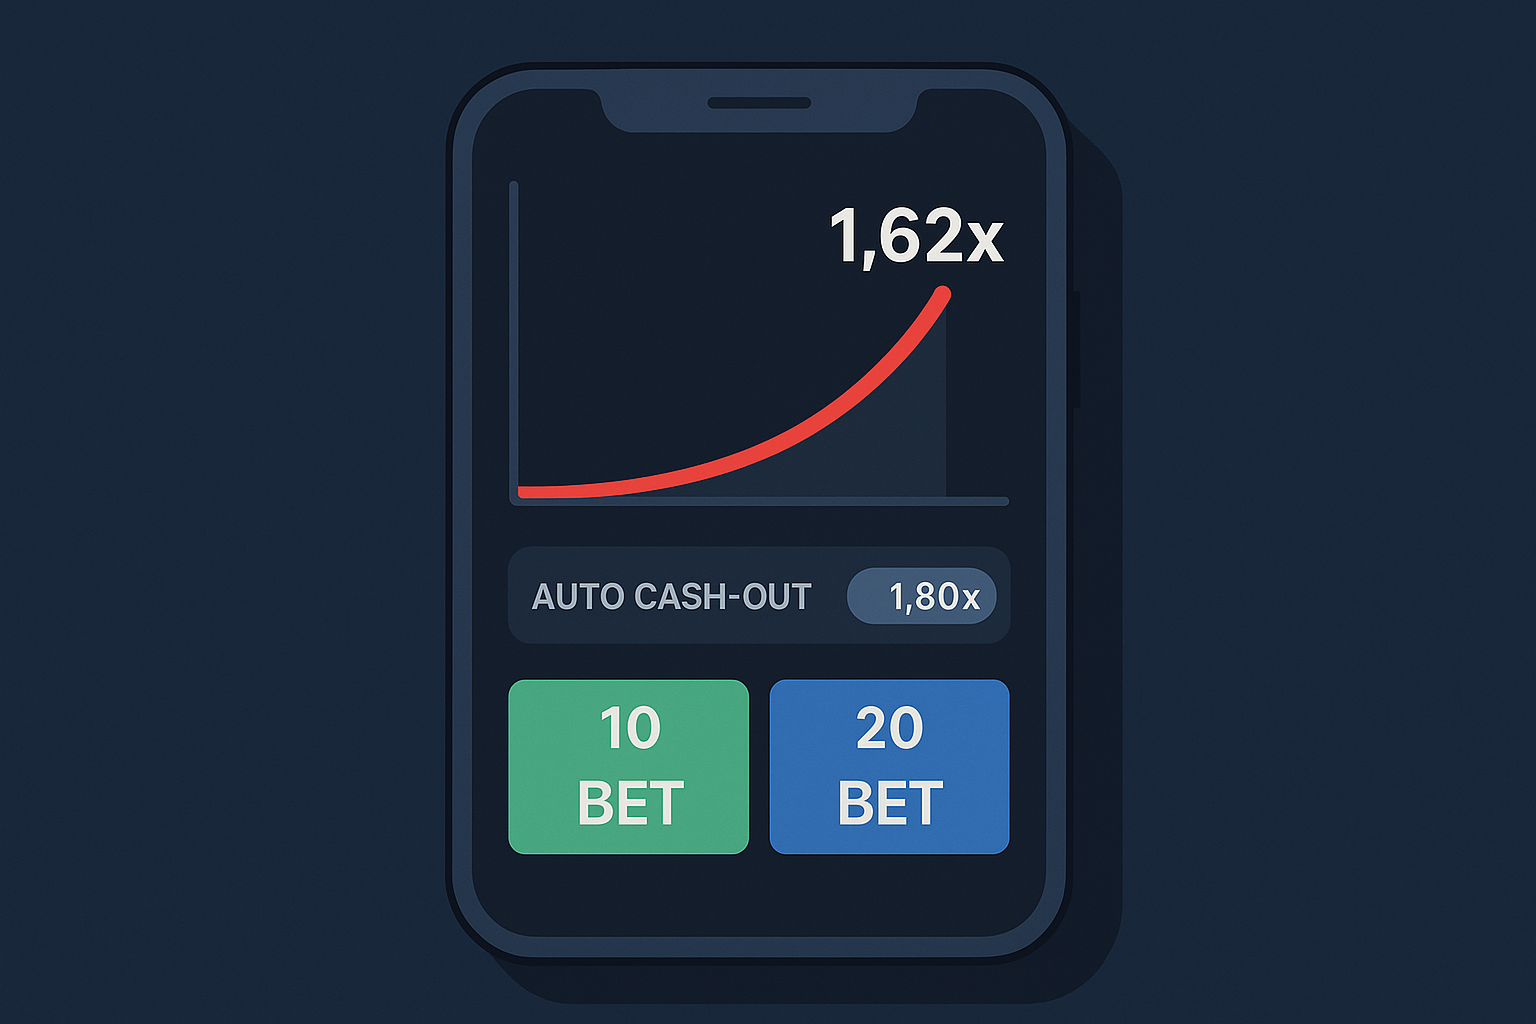
During a round, the plane climbs and the multiplier rises from 1.00x. The curve you see is an animation of that rising number over time, and it steepens as the multiplier grows. When the round ends, the plane leaves and the curve freezes at the crash point.
Here’s the part that trips people up: the crash point was already determined before the plane took off. In Spribe’s Aviator, the result for each round is produced by a provably fair system that combines a server seed with seeds contributed by players, and you can verify after the round that the outcome wasn’t altered mid-flight. The curve isn’t “deciding” anything while it climbs. It’s revealing a number that already exists, second by second, which is exactly why the animation feels so tense.
So reading the aviator curve while it climbs gives you no information about how much higher it will go. The only decision the curve supports is a simple one: cash out now, or keep the bet in.
Why past rounds can’t predict future multipliers
Because the outcomes are statistically independent. A round that ended at 1.01x does not make the next round more likely to be high, and a run of 50x results does not “use up” the big multipliers.
How Aviator’s RNG works
The aviator RNG produces a fresh random result for each round from cryptographic seeds. There’s no memory, no counter tracking how much the game has paid out recently, and no adjustment based on how many players cashed out early. The provably fair setup exists so you can check that a specific round wasn’t tampered with, not so you can predict the next one. In fact, verifiability and predictability are opposites here: if you could derive round N+1 from round N, the system would be broken.
If you want the mechanics in more depth, our guide to how Aviator’s RNG and provably fair verification work walks through the seed process step by step.
The independence of each round
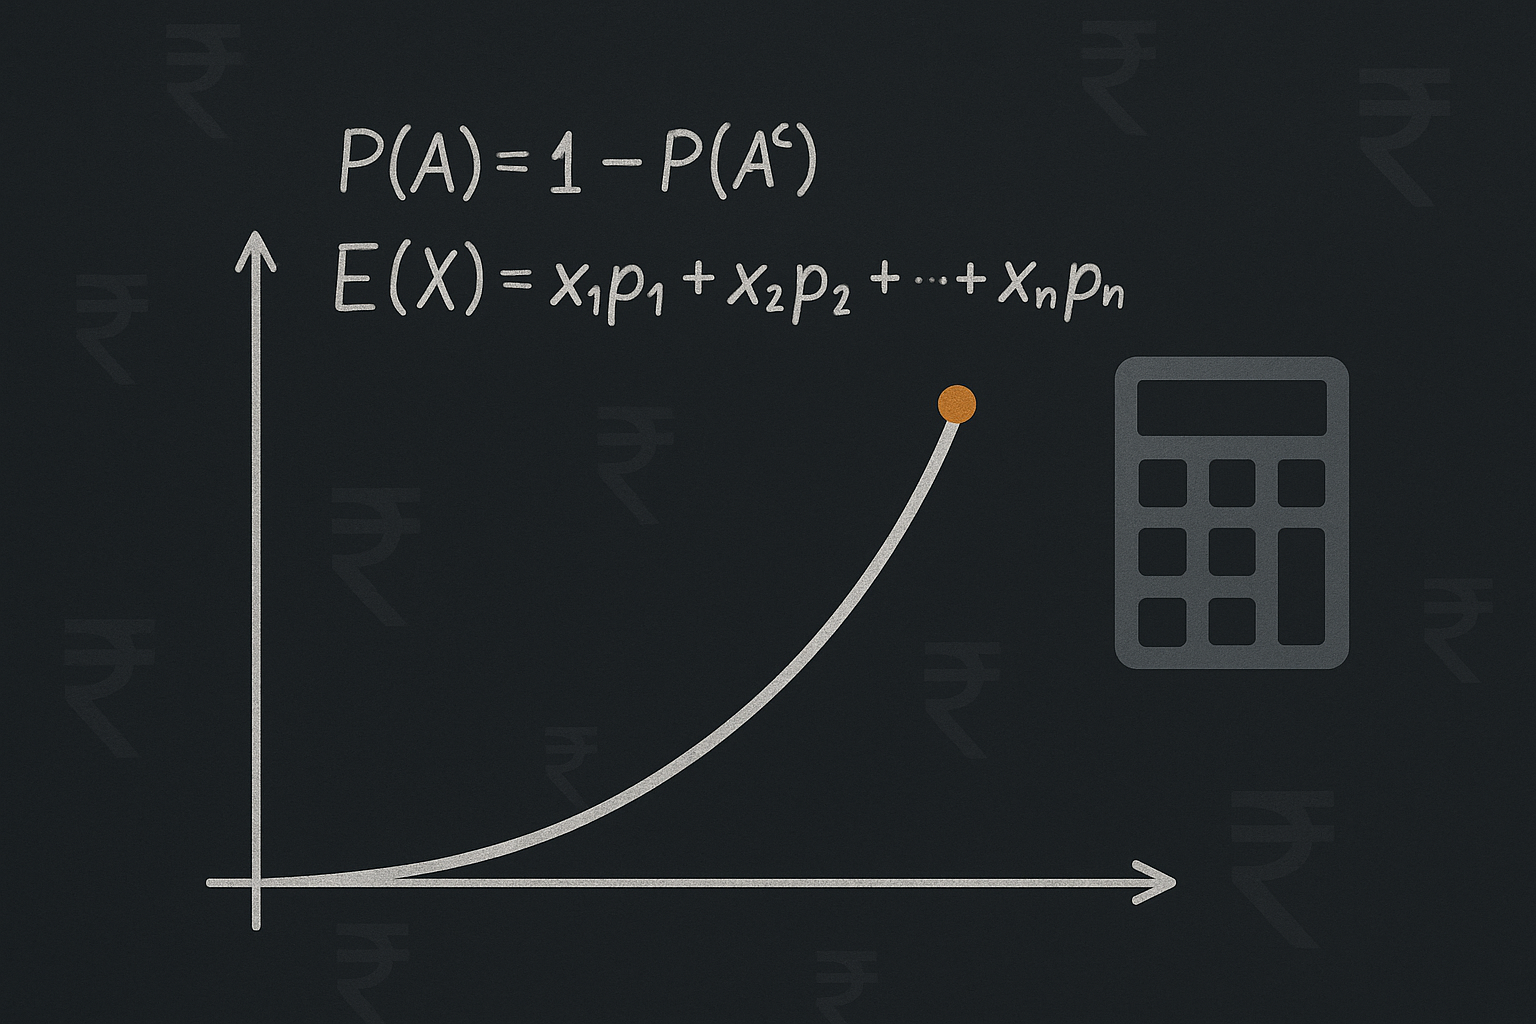
Statistical independence means the probability of the next outcome is unchanged by previous outcomes. Assuming Aviator’s published RTP of 97% (worth confirming in the game’s own info panel, since operators can host different versions), the standard crash model gives a clean approximation: the chance of a round reaching a multiplier of x or higher is about 0.97 divided by x.
| Target multiplier | Approx. chance of reaching it | Roughly how often |
|---|---|---|
| 1.50x | ~64.7% | About 2 rounds in 3 |
| 2.00x | ~48.5% | Slightly under half |
| 5.00x | ~19.4% | About 1 in 5 |
| 10.00x | ~9.7% | About 1 in 10 |
| 50.00x | ~1.9% | About 1 in 51 |
| 100.00x | ~1.0% | About 1 in 100 |
Those figures are the same on round 1 and round 1,000. They’re the same after ten straight crashes below 1.20x. That last sentence is where the gambler’s fallacy lives: the belief that an outcome becomes “due”. It doesn’t. The plane has no idea what it did last round.
Why streaks and patterns feel meaningful (but aren’t)
Pattern recognition in random data
Humans are extremely good at finding structure, including structure that isn’t there. Show someone 60 numbers and they’ll find rhythm in them: “it does two low ones then a big one”, “it always spikes after a 1.00x”. The brain rewards the hit and quietly discards the twenty times the supposed pattern failed. Add the fact that you only remember the rounds you were watching, and a false rule can feel field-tested after one session.
There’s also a design factor. The colour coding and the shape of the curve turn a plain list of numbers into something that looks like a chart, and charts imply trends. A price chart has trends because prices are connected over time. A crash history has none, because the data points aren’t connected at all.
Why streaks are normal
Streaks aren’t glitches in randomness, they’re a requirement of it. Using the 97% RTP model, roughly 51.5% of rounds crash below 2.00x. So the chance of five straight rounds under 2.00x is about 0.515 to the fifth power, or roughly 3.6% — around one time in 28. In a 100-round session, sequences like that turn up regularly.
Run it the other way. The chance a round reaches 10x is about 9.7%, so the chance that 20 consecutive rounds all stay below 10x is about 13%. A twenty-round “cold spell” for big multipliers is a normal Tuesday, not a signal that the game is about to pay.
| Streak | Approx. probability | Interpretation |
|---|---|---|
| 3 rounds in a row under 2.00x | ~13.7% | Happens constantly |
| 5 rounds in a row under 2.00x | ~3.6% | Expected several times per long session |
| 8 rounds in a row under 2.00x | ~0.5% | Uncommon, still not unusual over thousands of rounds |
| 20 rounds with no 10x or higher | ~13% | Completely ordinary variance |
None of these numbers change what comes next. They just explain why the history strip looks “streaky” to the eye even though it’s plain variance doing exactly what variance does.
What data actually matters for Aviator strategy
House edge and expected value
The number that genuinely governs your results is the house edge. At a published RTP of 97%, the edge is 3%: over the long run the game returns about ₹97 for every ₹100 wagered, which is an average loss of ₹3 per ₹100 staked. Some crash titles advertise 99% RTP, a 1% edge; check the specific game’s info screen rather than assuming. Either way the expected value of a bet is negative, and no cash-out point changes that.
This is worth spelling out because it kills a whole family of “systems”. Cashing out early at 1.30x gives frequent small wins and rare large drawdowns. Holding for 20x gives long dry runs and occasional big hits. Both carry the same house edge. What changes is variance: how bumpy the ride is and how fast your balance can swing. That’s a comfort and bankroll decision, not an edge.
Bankroll management over pattern reading
The aviator statistics panel in most builds shows things like your own bet history, biggest multipliers over a period, and sometimes the distribution of recent results. Use it as a mirror, not a crystal ball. The questions worth asking are about your own behaviour:
- What percentage of my bankroll is one bet? A stake that survives an eight-round losing streak is the difference between playing and reloading.
- Am I raising my stake after losses? Chasing a loss is the most expensive habit in crash games, and the maths gives it no justification whatsoever.
- Do I have a session loss limit and a time limit, set before I start rather than during?
- Am I using auto cash-out to enforce my own plan, instead of freezing and holding a round I meant to close?
Our piece on Aviator bankroll management and cash-out planning goes into stake sizing and how auto cash-out settings interact with variance.
Common Aviator graph analysis myths debunked
“The game is cold, a big multiplier is due.” No outcome is ever due. The RNG has no memory, so the probability of a 10x round is the same after twenty low rounds as it is after a 200x.
“After a 1.00x instant crash, the next round is usually high.” An instant crash is just a very low result. It carries no information forward. If you’ve noticed this pattern, you’ve noticed the times it held and forgotten the times it didn’t.
“Hot streaks mean the game is paying right now.” Clusters of high multipliers are what random sequences look like. Treating a cluster as an ongoing state usually means increasing stakes right when nothing has actually changed.
“Reading the curve’s shape tells you when to cash out.” The curve is an animation of a number that was already fixed before the round started. Its steepness reflects time elapsed, not proximity to the crash point.
“Predictor apps and hack signals can read the graph.” They cannot, and they’re a real risk. Anything selling next-round predictions is either guessing or after your money and account details. Provably fair round generation exists precisely so outcomes aren’t knowable in advance.
“Tracking thousands of rounds will reveal the pattern.” Large samples do reveal something useful, just not what pattern hunters want: they converge toward the game’s published probabilities and confirm the house edge. That’s the opposite of an exploit.
FAQ
What does the Aviator graph actually show?
The live curve shows the current round’s multiplier rising over time until the plane leaves, and the history strip shows the crash multipliers of completed rounds. Both are records of RNG output, with no predictive content.
Can past rounds predict the next multiplier?
No. Rounds are statistically independent, so the probability of any given multiplier is identical regardless of what came before it.
Does graph analysis work for Aviator?
Not for prediction. It’s useful only for understanding variance and reviewing your own betting behaviour. The house edge stays the same whatever you read into the history.
Why do multipliers look streaky?
Because streaks are a normal feature of random sequences. Five consecutive rounds below 2.00x has roughly a 3.6% chance, which means it shows up often across a long session.
Aviator is entertainment with a built-in mathematical edge for the operator, and no reading of the graph changes that. Set a budget you’re fine losing before you open the game, use deposit and session limits, and step away if play stops feeling optional. If it’s becoming a problem, our responsible gambling resources list support options and self-exclusion tools. Aviator and other real money games are for adults aged 18 and over.